Table of Contents
This article shows a few metrics and statistics on how the Jomic project evolved over time.
Jomic is a comic viewer written in Java. For this language, many tools exist to measure various metrics about source code and testing. While these reports are nice and useful, they do not show how these metrics evolve over time. However, this information would be much needed for several reasons. First, many metrics are pretty abstract and do not tell much at a particular point of time. What's really interesting is not a current value rather a trend shown by several consecutive values. Next, after a major reorganization of the code, they allow to check if the cleanup did change anything from a "distant" metrical view. And finally, the trends pointed out by the graphs in this chapter make it easier to see where parts of the code or testing process degenerated for a while, and refactoring or extension is needed the most.
So far, the metrics are derived from reports generated by Checkstyle, Emma and JDepend. With
every release of Jomic, the current metrics are checked in the Subversion repository under
/trunk/reports. A little Python script named
create-metrics.py
collects and prepares them for
gnuplot.
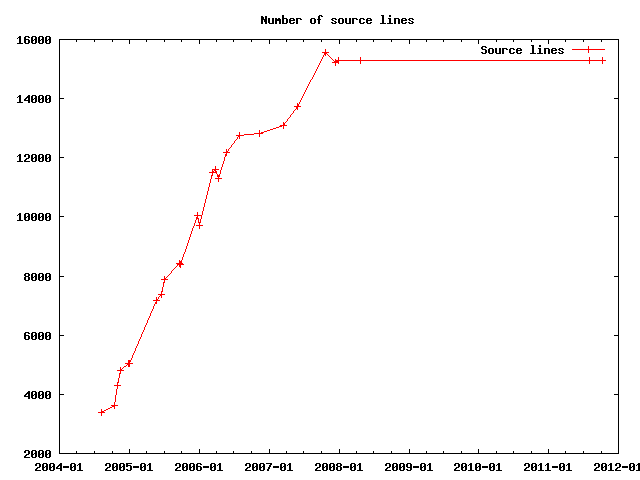
The number of lines of source code (excluding non-source such as empty lines or comments) has been one of the first metrics of software engineering. Not because it is so incredibly useful rather than because it is quite easy to obtain.
In case of Jomic, it does not hold any surprises: as features are added, the source code increaeses.
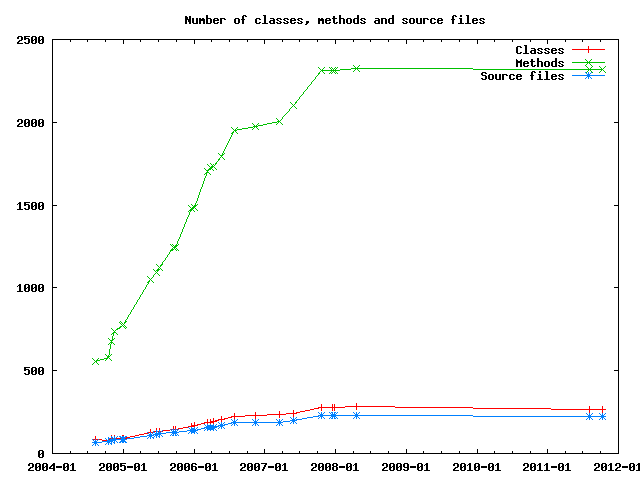
Jomic is written in Java, which splits a program in classes and methods. Apparently both of them increase like like lines of source code:
Interesting about the previous graphs is that while the code size increases, the average number of lines per method remains pretty constant:
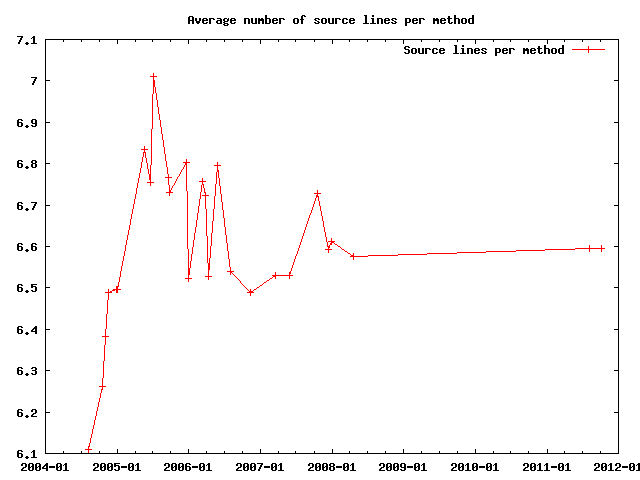
This shows a certain quality of the code because huge methods are harder to understand. Consequently applying the principle of "devide and conquer" by splitting up complex interactions in smaller methods increases the legibility.
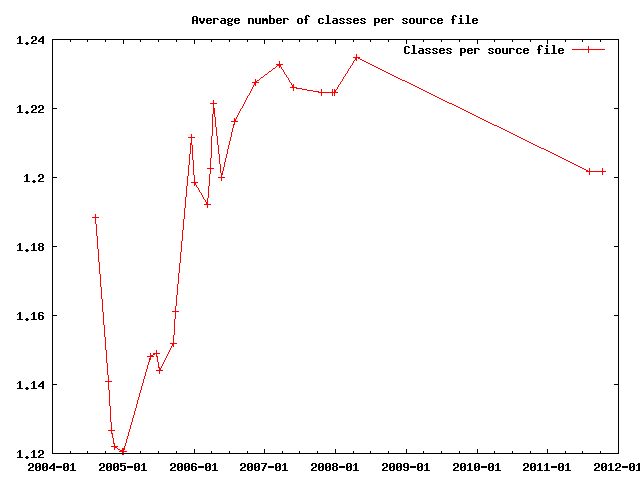
However, the number of methods per class does not keep up with this:
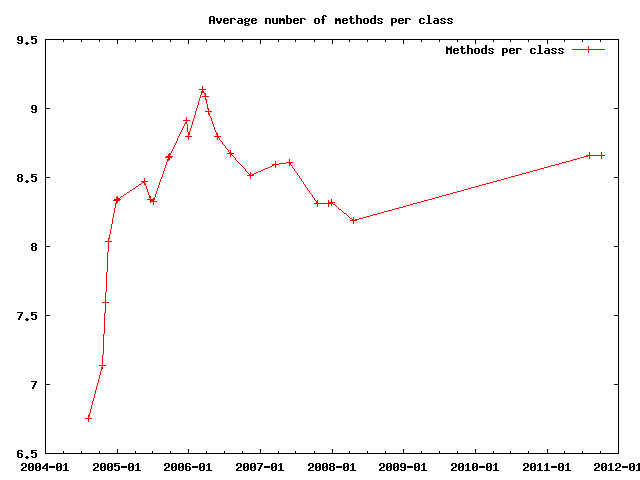
As a sidenote, Java offers a feature called inner classes where a class can contain other classes, usually tightly bound to the parent class. Apparently I'm not a big fan of this, though it hardly can be avoided - especially for GUI programming and multi-threading:
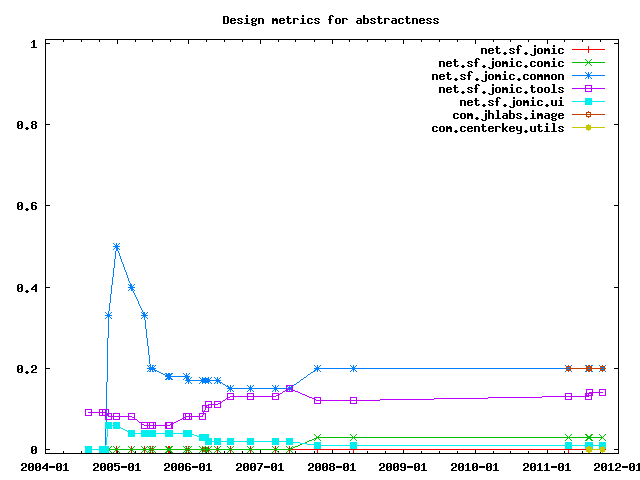
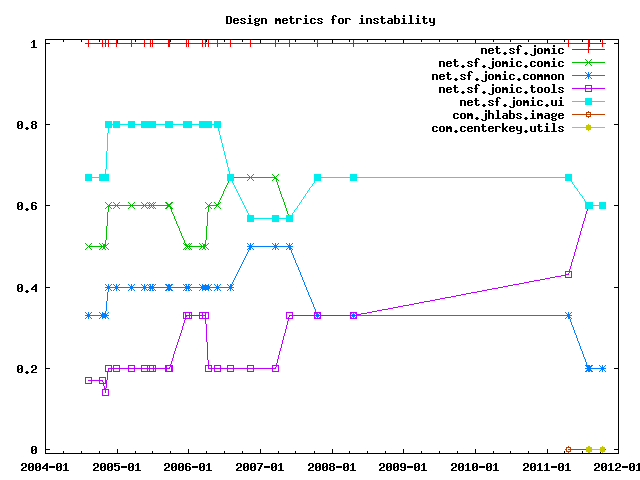
The actual value of design metrics is debatable, what's interesting however is how these metrics evolve over time. Here are three metrics computed by JDepend. The defintinions of these metrics are copied from the JDepend manual.
Abstractness is the ratio of the number of abstract classes (and interfaces) in the analyzed package to the total number of classes in the analyzed package. The range for this metric is 0 to 1, with Abstractness=0 indicating a completely concrete package and Abstractness=1 indicating a completely abstract package.
Instability is the ratio of efferent coupling (Ce) to total coupling (Ce + Ca) such that Instability = Ce / (Ce + Ca). This metric is an indicator of the package's resilience to change. The range for this metric is 0 to 1, with Instability=0 indicating a completely stable package and Instability=1 indicating a completely instable package.
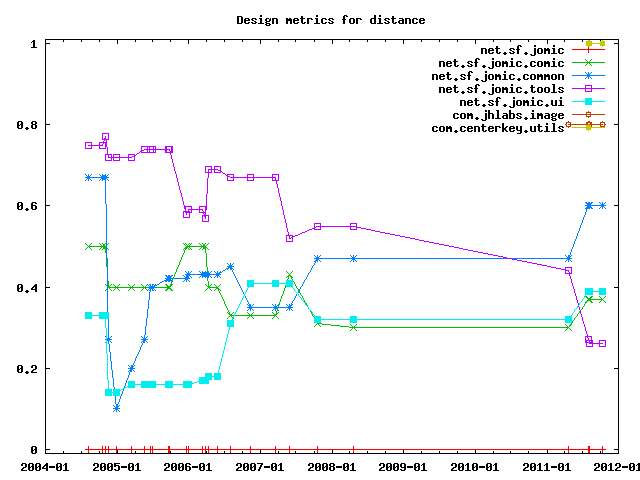
The distance from the main sequence is the perpendicular distance of a package from the idealized line (Abstractness + Instability = 1). This metric is an indicator of the package's balance between abstractness and stability. A package squarely on the main sequence is optimally balanced with respect to its abstractness and stability. Ideal packages are either completely abstract and stable (x=0, y=1) or completely concrete and instable (x=1, y=0). The range for this metric is 0 to 1, with Distance=0 indicating a package that is coincident with the main sequence and Distance=1 indicating a package that is as far from the main sequence as possible.
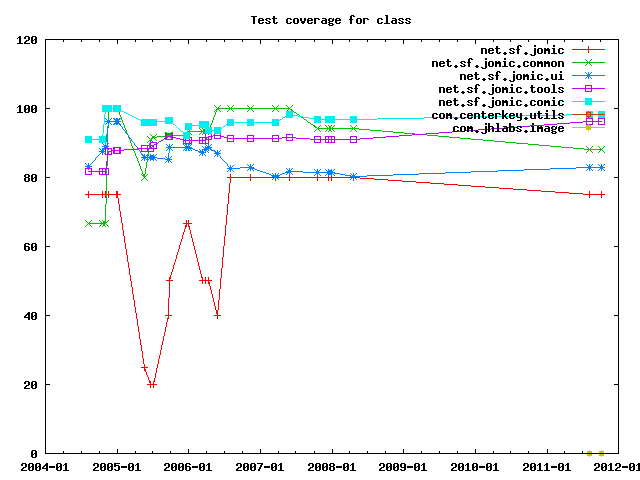
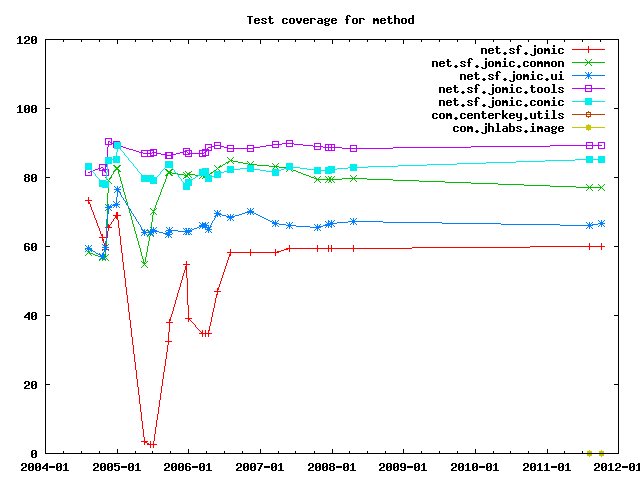
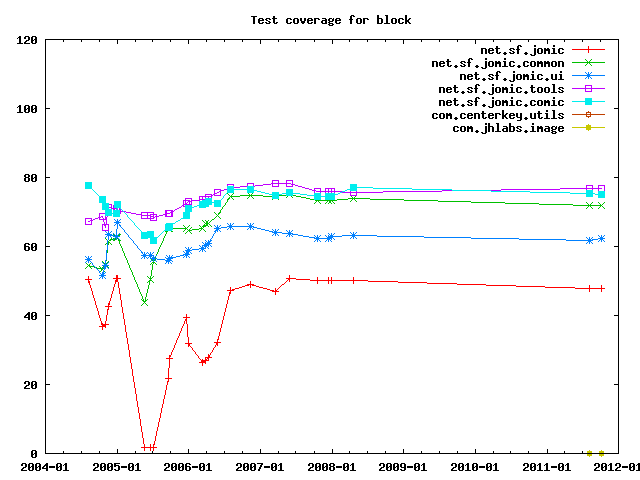
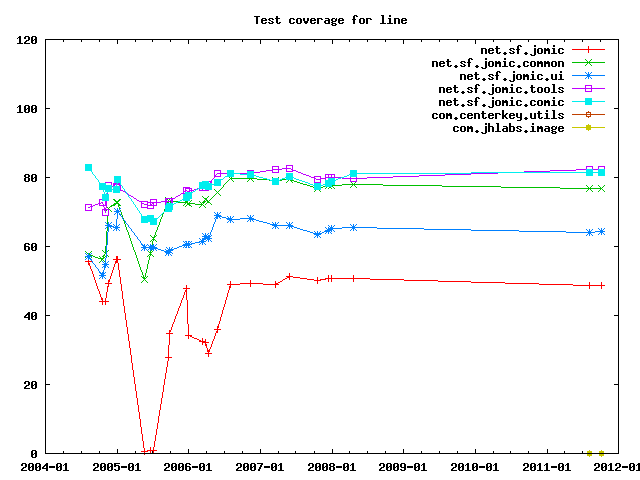
Test coverage measures how much of the code has been exercised by test cases.
There are different ways to format and organize source code and people often do not agree which is the best. Different styles have established. This is particular true for Java, which partially which tried to find a trade off between being a sensible programming language without being repulsive for people that grew up with C and C++. Because of that you can do a lot of stupid and ugly things wihtout getting slapped at the wrist by the compiler. In bigger projects, it is common to reduce the amount of chaos caused by people who grew up with C and C++ by using tools that point out stupid and ugly things in the source code.
One such tool is Checkstyle, which collects issues for every source file similar to compiler error. The only difference is that the code still compiles and runs, but at least you know that something is fishy.
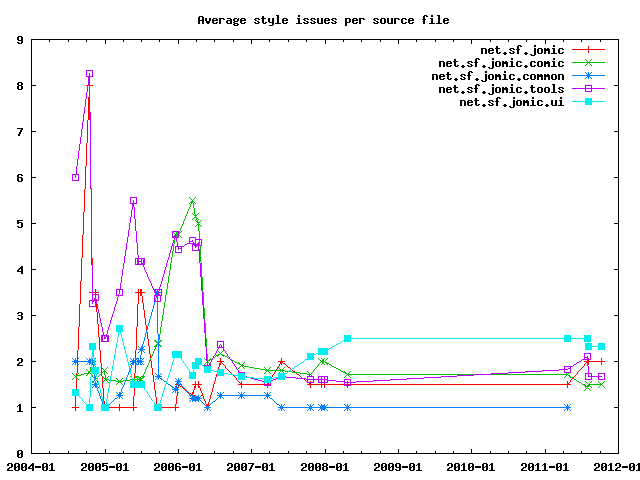
The probably most meaningful metric from this is how many issues per source file are detected for each package.
In some cases, it is more useful to see the absolute number of changes, for example when moving files from one package to another or changing the Checkstye configuration.
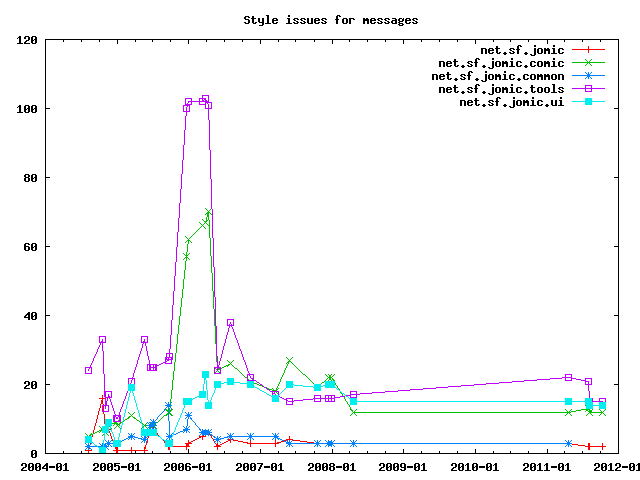
Aparently, the number of issues increased a lot in late 2005. This happened because test code was included in the check. While this basically makes sense, some of the checks for normal source code do not go well with test code. For example, numeric constants are discouraged in application code because the meaning of the number is not clear. In test code however, many test cases uses numbers for expected values to compare the actual result with. In April 2006 this was fixed by adding approriate suppressors for test code checks.